Role
Product Designer
Duration
1 weeks
Industry
B2B Fintech / Credit Infrastructure
Focus
Risk visibility, fraud prevention, loan decisioning
Role
Product Designer
Duration
1 weeks
Industry
B2B Fintech / Credit Infrastructure
Focus
Risk visibility, fraud prevention, loan decisioning
The Problem (why this matters)
As lending platforms grow, teams face three major issues:
1. Too much data, not enough clarity
Numbers everywhere, but no clear answers.
2. Problems show up too late
Missed payments are often the last signal, not the first.
3. Risk hides in patterns
Fraud and defaults often come from hidden connections, not single borrowers.
The result:
• Bad loans
• Revenue loss
• Stressful decision-making
• Damage to trust
Who Credos Is For
Credos is used by different people, each with different needs:
• Executives → “Are we safe right now?”
• Risk teams → “Which loans need attention?”
• Credit officers → “Should we approve this loan?”
• Fraud teams → “Is someone gaming the system?”
The challenge was designing one system that works for all of them.
The Problem (why this matters)
As lending platforms grow, teams face three major issues:
1. Too much data, not enough clarity
Numbers everywhere, but no clear answers.
2. Problems show up too late
Missed payments are often the last signal, not the first.
3. Risk hides in patterns
Fraud and defaults often come from hidden connections, not single borrowers.
The result:
• Bad loans
• Revenue loss
• Stressful decision-making
• Damage to trust
Who Credos Is For
Credos is used by different people, each with different needs:
• Executives → “Are we safe right now?”
• Risk teams → “Which loans need attention?”
• Credit officers → “Should we approve this loan?”
• Fraud teams → “Is someone gaming the system?”
The challenge was designing one system that works for all of them.
My design philosophy
I didn’t start with screens, started with questions people ask at work. From conversations and interviews, I heard things like:
• “We always find out too late.”
• “I don’t trust the score alone.”
• “We miss patterns across borrowers.”
• “Executives want answers, not charts.”
That shaped the entire product.
CredOS
A credit intelligence platform for smarter lending decisions
CredOS
A credit intelligence platform for smarter lending decisions

My design philosophy
I didn’t start with screens, i started with questions people ask at work. From conversations and interviews, I heard things like:
• “We always find out too late.”
• “I don’t trust the score alone.”
• “We miss patterns across borrowers.”
• “Executives want answers, not charts.”
That shaped the entire product.
Screen Designed
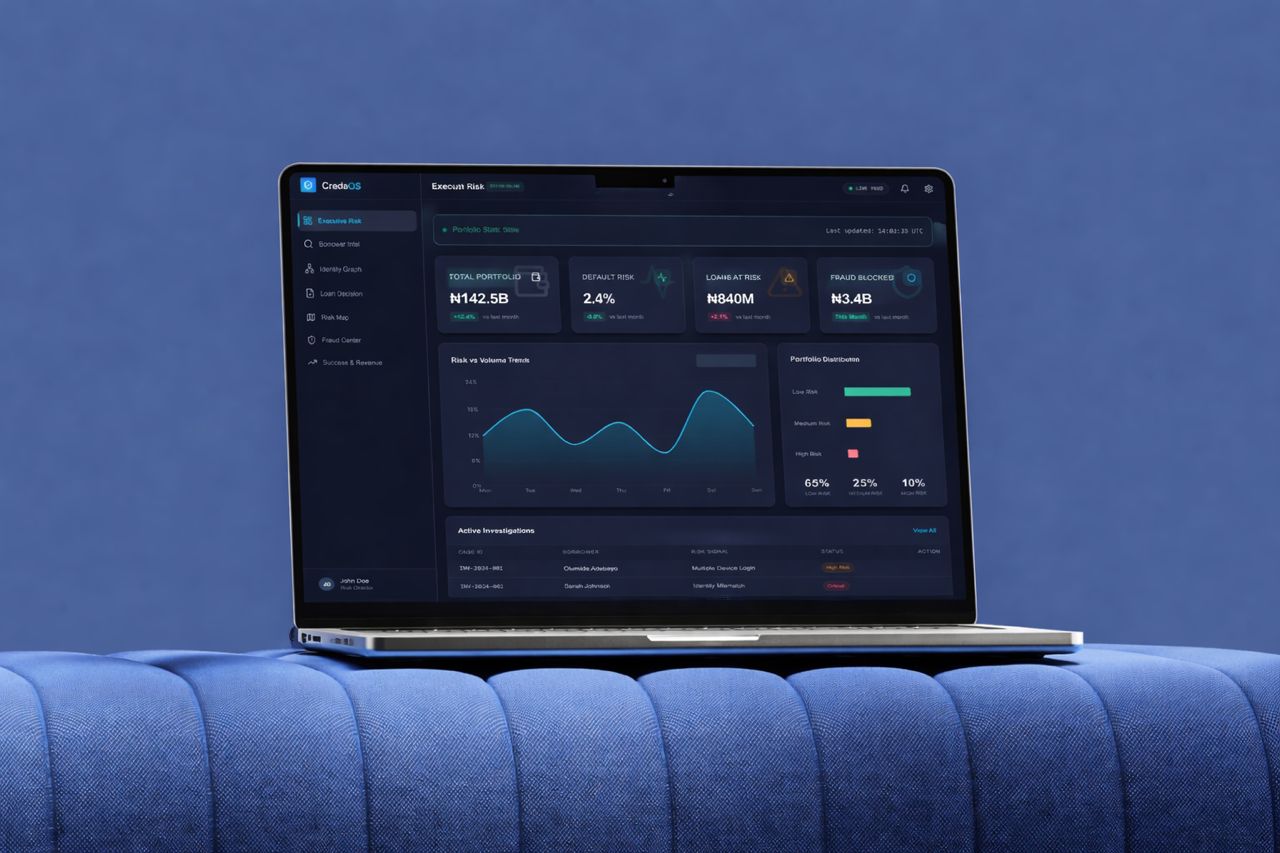
1. Executive Risk
Executive Risk Dashboard Overview
This is a health check for leadership.
It shows:
• How much money is safe
• How much is at risk
• Whether risk is rising or falling
No deep analysis required, just clarity.

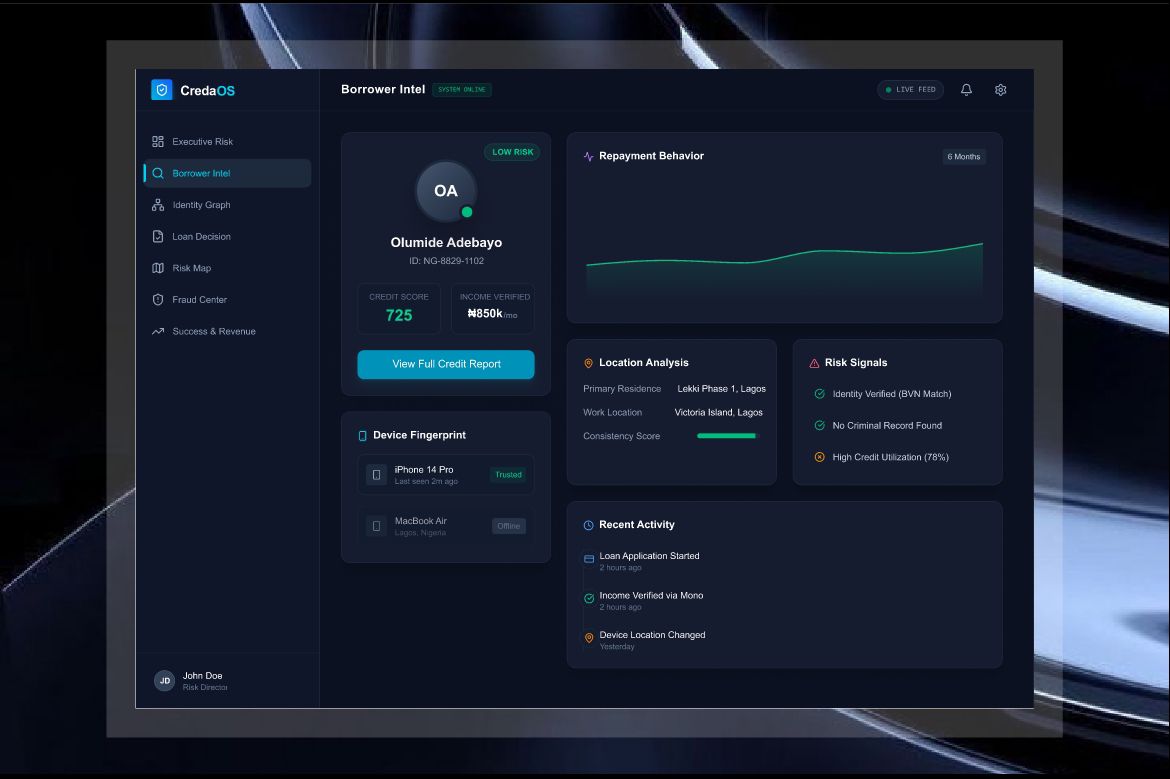
2. Borrowers Intel
Borrowers Intel Dashboard Overview
This explains the borrower beyond a number.
It shows:
• Payment behavior over time
• Stability signals
• Anything unusual
The goal is to understand the person, not just judge them.
Identity Graph
Identity Graph Dashboard Overview
This shows whether borrowers are linked in ways that aren’t immediately obvious.
For example:
• Multiple loans coming from the same device
• Shared behavior patterns across different accounts
• Groups of borrowers connected through usage, location, or activity
If several people within the same connected circle have defaulted, and a new borrower from that same network applies for a loan, the system flags a higher risk immediately.
This helps teams spot coordinated risk early, catching problems that look normal on the surface but are risky underneath.

Loan Decision
Loan Decision Dashboard Overview
This screen helps teams decide:
• Approve
• Review
• Decline
And explains why, No mystery. No guessing.

Risk Map
Risk Map Dashboard Overview
This shows where loan risk and opportunity come from geographically. It highlights regions with high default patterns and compares them with areas that perform better.
For example, Lagos has a large number of borrowers, but a higher default rate. Ibadan has fewer borrowers, but significantly stronger repayment behavior. While Lagos looks attractive on volume, Ibadan delivers better risk-adjusted returns.
The insight isn’t “avoid Lagos” or “only lend in Ibadan.” It’s knowing where to increase exposure, where to tighten controls, and where capital works harder.
In this case, Ibadan brings the most return, because capital is repaid more consistently, losses are lower, and growth is sustainable.

Fraud Center
Fraud Center Dashboard Overview
This is where the system flags potential fraud the moment a loan is applied for.
Using behavior and pattern analysis, it identifies profiles that show a high likelihood of default or manipulation before any money is released.
Suspicious cases are prioritized by potential impact, so teams know exactly what to review first.
The result: faster decisions, less manual review, and fraud stopped before it becomes a loss.

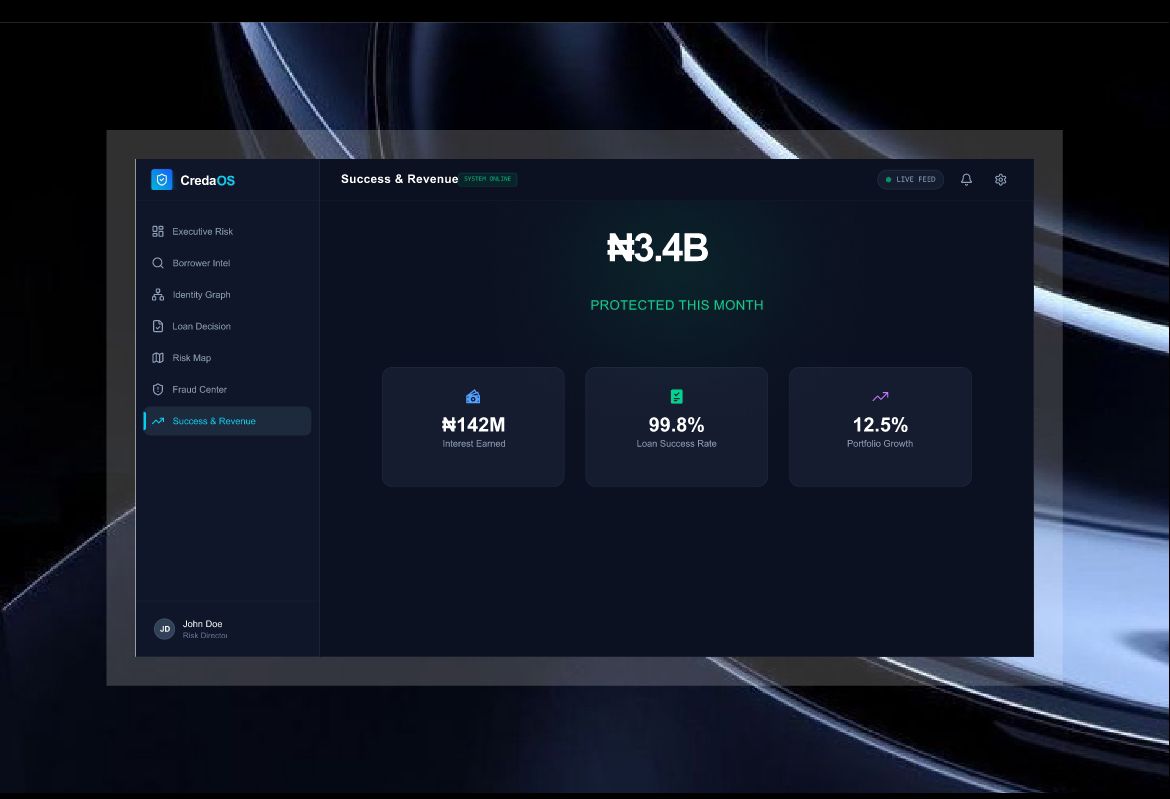
Success and revenue
Success and revenue Dashboard Overview
This connects decisions to results.
It shows:
• Losses avoided
• Revenue protected
• Better approval quality
This proves the system’s value.
Screen Designed
Visual design
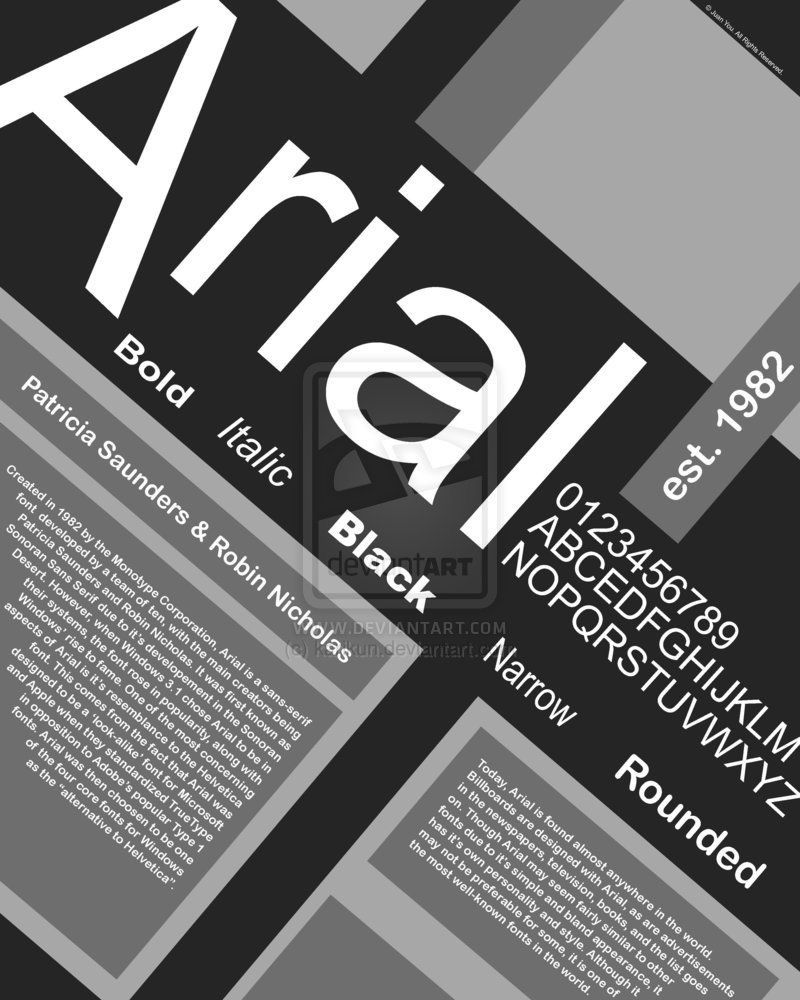
• Simple typography : Easy to read, even with lots of data
• Calm colors : Red only when something truly matters
• Clear spacing : Reduces stress and confusion
• Subtle motion : Helps users notice changes without distraction
The goal wasn’t beauty, it was confidence.
Impact (intended outcomes)
Credos helps teams:
• Catch risky loans earlier
• Reduce fraud quietly
• Make faster, safer decisions
• Protect revenue before it disappears
This turns risk management from a reaction into a strategy.
Visual Design
• Simple typography : Easy to read, even with lots of data
• Calm colors : Red only when something truly matters
• Clear spacing : Reduces stress and confusion
• Subtle motion : Helps users notice changes without distraction
The goal wasn’t beauty, it was confidence.
Impact (intended outcomes)
Credos helps teams:
• Catch risky loans earlier
• Reduce fraud quietly
• Make faster, safer decisions
• Protect revenue before it disappears
This turns risk management from a reaction into a strategy.
Let’s build something users trust
I’m open to freelance, contract, and full-time opportunities. If you’re building a product and need clear UX, strong UI, and thoughtful user flows, let’s talk.
Let’s build something users trust
I’m open to freelance, contract, and full-time opportunities. If you’re building a product and need clear UX, strong UI, and thoughtful user flows, let’s talk.
Back
Back
Visual design
• Simple typography : Easy to read, even with lots of data
• Calm colors : Red only when something truly matters
• Clear spacing : Reduces stress and confusion
• Subtle motion : Helps users notice changes without distraction
The goal wasn’t beauty, it was confidence.
What this Matters
Good design isn’t just about making things look good.
In products like this:
• Design protects money
• Design builds trust
• Design changes outcomes
Credos is an example of how thoughtful product design can prevent loss before anyone feels the pain
What this Matters
Good design isn’t just about making things look good.
In products like this:
• Design protects money
• Design builds trust
• Design changes outcomes
Credos is an example of how thoughtful product design can prevent loss before anyone feels the pain
What this Matters
Good design isn’t just about making things look good.
In products like this:
• Design protects money
• Design builds trust
• Design changes outcomes
Credos is an example of how thoughtful product design can prevent loss before anyone feels the pain
1. Executive Risk
Executive Risk Dashboard Overview
This is a health check for leadership.
It shows:
• How much money is safe
• How much is at risk
• Whether risk is rising or falling
No deep analysis required, just clarity.
2. Borrowers Intel
Borrowers Intel Dashboard Overview
This explains the borrower beyond a number.
It shows:
• Payment behavior over time
• Stability signals
• Anything unusual
The goal is to understand the person, not just judge them.
3. Identity Graphl
Identity Graph Dashboard Overview
This shows whether borrowers are linked in ways that aren’t immediately obvious.
For example:
• Multiple loans coming from the same device
• Shared behavior patterns across different accounts
• Groups of borrowers connected through usage, location, or activity
If several people within the same connected circle have defaulted, and a new borrower from that same network applies for a loan, the system flags a higher risk immediately.
This helps teams spot coordinated risk early, catching problems that look normal on the surface but are risky underneath.
4. Loan Decision
Loan Decision Dashboard Overview
This screen helps teams decide:
• Approve
• Review
• Decline
And explains why.
No mystery. No guessing.
5. Risk Map

Risk Map Dashboard Overview
This shows where loan risk and opportunity come from geographically. It highlights regions with high default patterns and compares them with areas that perform better.
For example, Lagos has a large number of borrowers, but a higher default rate. Ibadan has fewer borrowers, but significantly stronger repayment behavior. While Lagos looks attractive on volume, Ibadan delivers better risk-adjusted returns.
The insight isn’t “avoid Lagos” or “only lend in Ibadan.” It’s knowing where to increase exposure, where to tighten controls, and where capital works harder.
In this case, Ibadan brings the most return, because capital is repaid more consistently, losses are lower, and growth is sustainable.
6. Fraud Center
Fraud Center Dashboard Overview
This is where the system flags potential fraud the moment a loan is applied for.
Using behavior and pattern analysis, it identifies profiles that show a high likelihood of default or manipulation before any money is released.
Suspicious cases are prioritized by potential impact, so teams know exactly what to review first.
The result: faster decisions, less manual review, and fraud stopped before it becomes a loss.
7. Success and revenue
Sucess and revenue Dashboard Overview
This connects decisions to results.
It shows:
• Losses avoided
• Revenue protected
• Better approval quality
This proves the system’s value.
1. Executive Risk
Executive Risk Dashboard Overview
This is a health check for leadership.
It shows:
• How much money is safe
• How much is at risk
• Whether risk is rising or falling
No deep analysis required, just clarity.
2. Borrowers Intel
Borrowers Intel Dashboard Overview
This explains the borrower beyond a number.
It shows:
• Payment behavior over time
• Stability signals
• Anything unusual
The goal is to understand the person, not just judge them.
3. Identity Graphl
Identity Graph Dashboard Overview
This shows whether borrowers are linked in ways that aren’t immediately obvious.
For example:
• Multiple loans coming from the same device
• Shared behavior patterns across different accounts
• Groups of borrowers connected through usage, location, or activity
If several people within the same connected circle have defaulted, and a new borrower from that same network applies for a loan, the system flags a higher risk immediately.
This helps teams spot coordinated risk early, catching problems that look normal on the surface but are risky underneath.
4. Loan Decision
Loan Decision Dashboard Overview
This screen helps teams decide:
• Approve
• Review
• Decline
And explains why.
No mystery. No guessing.
5. Risk Map
Risk Map Dashboard Overview
This shows where loan risk and opportunity come from geographically. It highlights regions with high default patterns and compares them with areas that perform better.
For example, Lagos has a large number of borrowers, but a higher default rate. Ibadan has fewer borrowers, but significantly stronger repayment behavior. While Lagos looks attractive on volume, Ibadan delivers better risk-adjusted returns.
The insight isn’t “avoid Lagos” or “only lend in Ibadan.” It’s knowing where to increase exposure, where to tighten controls, and where capital works harder.
In this case, Ibadan brings the most return, because capital is repaid more consistently, losses are lower, and growth is sustainable.
6. Fraud Center
Fraud Center Dashboard Overview
This is where the system flags potential fraud the moment a loan is applied for.
Using behavior and pattern analysis, it identifies profiles that show a high likelihood of default or manipulation before any money is released.
Suspicious cases are prioritized by potential impact, so teams know exactly what to review first.
The result: faster decisions, less manual review, and fraud stopped before it becomes a loss.
7. Success and revenue
Sucess and revenue Dashboard Overview
This connects decisions to results.
It shows:
• Losses avoided
• Revenue protected
• Better approval quality
This proves the system’s value.
Let’s build something users trust
I’m open to freelance, contract, and full-time opportunities. If you’re building a product and need clear UX, strong UI, and thoughtful user flows, let’s talk.
The Problem (why this matters)
As lending platforms grow, teams face three major issues:
1. Too much data, not enough clarity
Numbers everywhere, but no clear answers.
2. Problems show up too late
Missed payments are often the last signal, not the first.
3. Risk hides in patterns
Fraud and defaults often come from hidden connections, not single borrowers.
The result:
• Bad loans
• Revenue loss
• Stressful decision-making
• Damage to trust
Who Credos Is For
Credos is used by different people, each with different needs:
• Executives → “Are we safe right now?”
• Risk teams → “Which loans need attention?”
• Credit officers → “Should we approve this loan?”
• Fraud teams → “Is someone gaming the system?”
The challenge was designing one system that works for all of them.